
![]()
September 5, 2017
In the Hamilton Capital Global Bank ETF (HBG, HBG.U; TSX), the U.S. mid-cap bank portfolio reported another very strong quarter, posting portfolio weighted year-over-year earnings growth of ~20% – its fifth consecutive quarter of double-digit growth. As we have noted in the past, with over 150 mid-cap banks (i.e., those with market caps between $0.5 bln and $20 bln), there is greater opportunity to construct a portfolio with superior earnings potential and more targeted attributes including higher rate sensitivity, M&A potential, higher loan growth and valuation support.
HBG is up 3.7% year-to-date, significantly outperforming the U.S. banks through August 31, 2017. Over the same period, the KBW Regional Banking Index (KRX) has declined over 16% in CAD while the KBW Bank Index (BKX) is down 6% in CAD. This strong outperformance occurred despite the fact that U.S. banks and U.S. mid-cap banks, in particular, account for ~40% of HBG’s portfolio.
Why the disparate performance?
Stock selection has been the main driver. HBG’s U.S. bank portfolio continues to post earnings growth that exceeds that of all categories of U.S. banks, including the universals/mega-caps, large regionals, and small/mid-cap banks (SMIDs)[i]. This quarter was no different. In Q2, EPS growth for HBG’s U.S. bank portfolio was 20% (portfolio-weighted, year-over-year), making it the 5th consecutive quarter that earnings increased by double-digits.
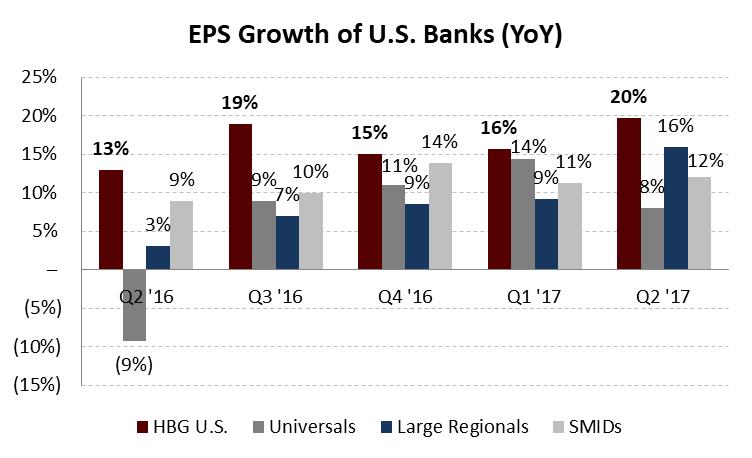
Source: KBW, Bloomberg, Company Reports, Hamilton Capital
HBG’s U.S. bank financial outperformance was driven by multiple factors:
- The holdings benefitted from expanding net interest margins (up 6 bps Y/Y), which combined with strong loan growth (+23%, aided by acquisitions), led to large increases in net interest income (+28%).
- Lending revenue was complemented by a 23% increase in non-interest income, far exceeding the growth of the universals (down 1%), which were negatively impacted by a slower trading quarter.
- Credit quality remained benign for HBG’s banks, with net charge-offs a reported 18 bps[ii] (annualized and as a % of average loans). This figure was lower than it was for both the large regionals and the mega-caps/universals (28 bps and 47 bps, respectively)
- As in previous quarters, improving efficiency ratios (non-interest expense divided by revenue) supported increases in ROE (+56 bps Y/Y, +20 bps Q/Q). After adjusting for one-time acquisition costs, the weighted-average ROE for HBG’s U.S. positions was ~10.5%, notably surpassing the median figures for the universals (9.4%), large regionals, and SMIDs (both 9.1%).
LAUNCHING TODAY: Hamilton Capital U.S. Mid-Cap Financials ETF (USD) (HFMU.U)
Today is the launch of the newest Hamilton Capital ETF, the Hamilton Capital U.S. Mid-Cap Financials ETF (USD) (HFMU.U; TSX). This U.S.–focused ETF provides investors with “pure play” exposure to a dynamic part of the global financial services sector that we believe stands to benefit from rising rates, improving GDP, ongoing sector consolidation, and exposure to faster growing states and regions. HFMU.U currently has ~60% of its portfolio invested in U.S. mid-cap banks, complemented by exposure to other diverse sub-sectors of the U.S. mid-cap financial services sector, including investment banks, insurance companies, brokerages, asset managers, and REITs, among others.
Notes
[i] Source: KBW. Median figures for 208 publicly-traded banks covered by the firm.
[ii] Excludes a notable one-time write down for a specific portfolio of one bank. If this action is included, the portfolio-weighted NCO ratio would be 28 bps.