Canadian Western Bank has achieved highly material long-term outperformance versus its larger peers. In this post, we relate its sizeable outperformance to our preference for U.S. mid-cap banks.
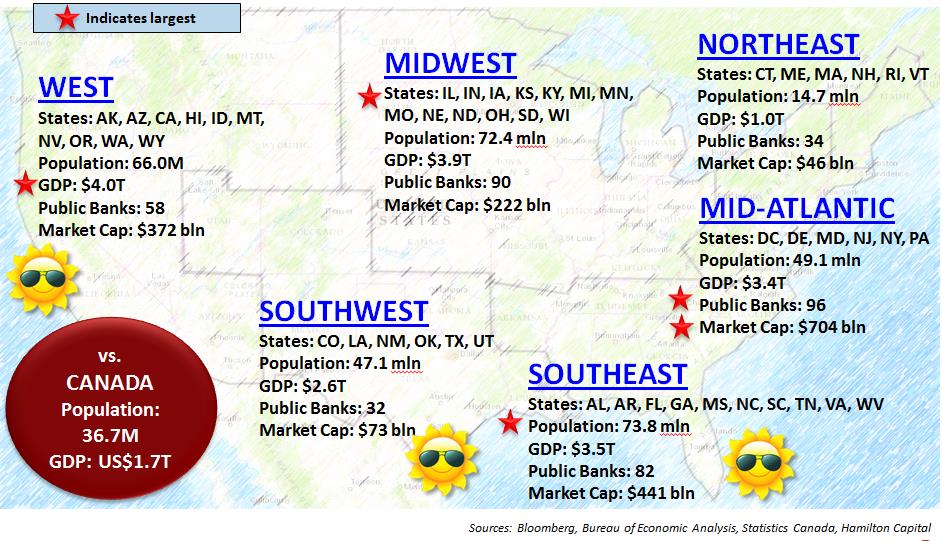
In our January 24, 2018 comment, “U.S. Banks: High/Low Growth Areas in One Map (i.e., ‘Follow the Sun’)”, we explained that there are vast demographic differences within the six distinct geographic regions of the United States (five of which are larger than Canada – see Chart 3). In this post, we noted that the fastest growing markets have population/GDP growth 3-4x faster than slower growth markets. These high-growth markets are overwhelmingly located in warmer climates – hence our title “Follow the Sun”.
Identifying higher growth markets is important because high quality companies operating in regions with superior demographic and economic metrics should, over the long-term, generate revenue/EPS growth superior to those operating in slow(er)-growth regions. In fact, economic growth can be more important to longer term returns, than say, ROE or business mix.
This brings us to the U.S. mid-cap financials sector, an enormous universe with over 500 publicly-traded firms and a combined market cap of ~US$2 trillion (i.e., as large as the Canadian equity markets). Most U.S. mid-caps operate in a handful of states (i.e., they do not operate on a national scale). Therefore, there are opportunities for active managers to assemble a portfolio of high quality firms with superior growth profiles owing in many cases to the favourable demographics/GDP growth of the markets in which they operate.
We launched the Hamilton Capital U.S. Mid-Cap Financials ETF (USD) (ticker, HFMU.U), to take advantage of these opportunities. To help explain the benefits of having exposure to the U.S. mid-cap financial sector, we thought we would offer a Canadian example of a high quality mid-cap operating in a high growth region: Canadian Western Bank (CWB).
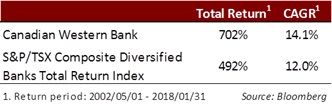
Since May 2002 (when Bloomberg started tracking the S&P/TSX Composite Diversified Banks Total Return Index, STDBNKR), Canadian Western Bank has outperformed its larger peers by ~200 bps per year – a highly significant amount. Specifically, CWB has risen more than 700% over this time, while the Big-6 Canadian banks index has risen closer to 500% (see table).
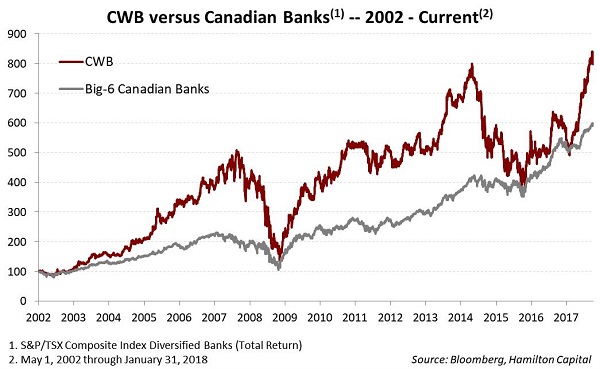
This outperformance is all the more impressive since this period: (i) effectively begins when stock prices for the Big-6 banks were depressed from the TMT1Telecom, Media and Technology credit cycle, and (ii) includes Alberta’s 2015/2016 deep recession, which weighed heavily on CWB’s results. The magnitude of CWB’s outperformance is further highlighted in the chart below.
Of note, although CWB is very well managed, it is not more profitable than its larger peers (i.e., it has a lower ROE). It is not as diversified as its larger peers and lacks a large wealth management platform. And it is not a significant player in residential mortgages, considered one of the most valuable products/businesses in Canadian banking (although not in the U.S.).
So, what explains CWB’s sizeable outperformance?
In a word: geography.
Canadian Western Bank operates primarily in the fastest growing markets in Western Canada, with deep roots in Alberta, historically, one of the wealthiest and fastest growing provinces in Canada. In fact, from 2002 to 2016, Alberta’s economy grew 2.6% per year on average, or nearly 40% faster than the Canadian economy, which grew 1.9% per year.2CWB’s outperformance was greatest when its growth outperformance was the most significant (or anticipated to improve). Conversely, when Alberta suffered in the most recent recession, not surprisingly, CWB underperformedSo, how does this pertain to U.S. mid-cap banks?
The U.S. is a gigantic market, with six distinct regions. With over 500 mid-cap financials (including 180 banks), specialist investors/active managers have the ability to gain targeted exposure to areas of the U.S. with superior GDP and population growth, namely the U.S. southeast and southwest and certain markets on the West Coast (see Chart 3).
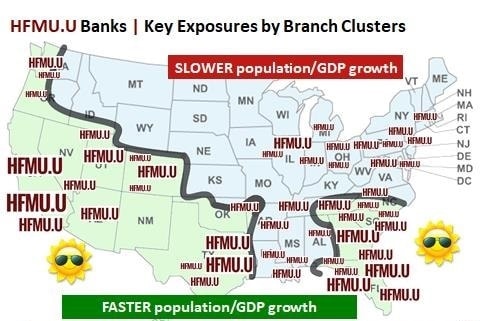
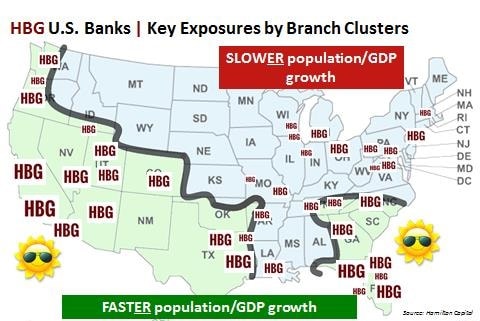
Such a targeted approach to portfolio construction underscores the investment strategy of the Hamilton Capital U.S. Mid-Cap Financials ETF (USD) (HFMU.U) and the U.S. portfolio of the Hamilton Capital Global Bank ETF (HBG) – see Charts 1 and 2 below. Both ETFs seek to invest in diversified portfolios of U.S. banks/financials with notably higher EPS profiles than the average.
In the most recent quarter – Q4 2017 – portfolio-weighted EPS growth for HFMU.U’s mid-cap financials was 18%, or nearly double that of the large-cap index (i.e. S&P 500 Financials). For HBG, its U.S. bank holdings had portfolio-weighted adjusted EPS growth of 19%, exceeding the sector average for the 7th consecutive quarter. This growth is strongly linked to the ETFs’ emphasis on companies operating in the U.S.’s higher growth areas.
Chart 1: Branch Cluster Map – Hamilton Capital U.S. Mid-Cap Financials ETF (USD)
Chart 2: Branch Cluster Map – Hamilton Capital Global Bank ETF
Chart 3: Breakdown of the United States by Region
As of September 2017.
Notes
1 TMT stands for Telecom, Media and Technology.
[2] CWB’s outperformance was greatest when its growth outperformance was the most significant (or anticipated to improve). Conversely, when Alberta suffered in the most recent recession, not surprisingly, CWB underperformed.
Note: Comments, charts and opinions offered in this commentary are produced by Hamilton Capital and are for information purposes only. They should not be considered as advice to purchase or to sell mentioned securities. Any information offered is believed to be accurate, but is not guaranteed.