
In Q1-2018, the holdings in the Hamilton Capital U.S. Mid-Cap Financials ETF (USD) [HFMU.U] have recorded year-over-year portfolio-weighted EPS growth of a robust 41%, which is well ahead of the 35% EPS growth reported by the U.S. large-cap financials. Last quarter – Q4-2017 – HFMU.U’s holdings outgrew the large-caps by 10% (i.e., 18% for HFMU.U versus 8% for the large-cap index).1
Perhaps more meaningful, excluding the impact of a lower corporate tax rate – i.e., an estimated 15% – the year-over-year EPS growth rate for HFMU.U was 25%, versus 21% for the large-cap index.
The largest contributor to HFMU.U’s superior earnings growth was the performance of its mid-cap bank holdings, which represent over 60% of the ETF (and are largely unrepresented in the index). These 40+ banks grew EPS by 42% Y/Y, which was nearly 500 bps better than the mega-caps, which represent a very substantial one-third of the U.S. large-cap financials index. That said, HFMU.U’s higher growth was evident across virtually all sub-sectors, including wealth management & others (HFMU.U at 52% versus 45% for the sub-sector within the US large-caps financials index).
With their strong gearing to regulatory reforms and eventual consolidation of the sector, U.S. mid-cap banks remain the largest allocation in HFMU.U. We also continue to expect earnings outperformance driven by their higher interest rate sensitivity and stronger credit growth, with lower tax rates acting as a tailwind for the sector.
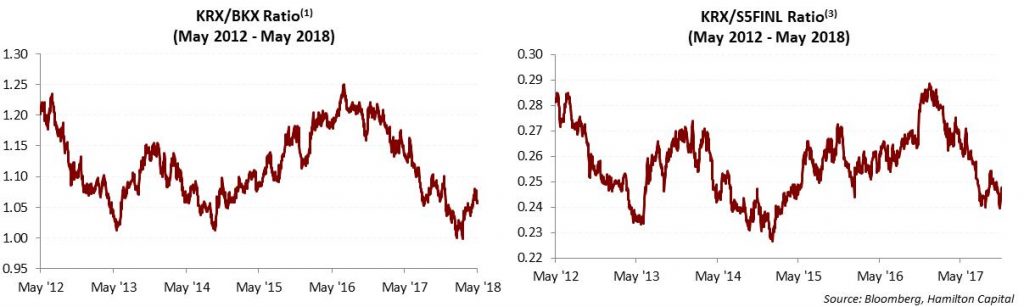
Yet, notwithstanding their superior EPS growth, the U.S. mid-caps are trading near 8 year lows versus the large-caps, who have disproportionately benefited from continued sector rotation into financials. The chart below shows U.S. mid-caps are historically oversold.
With over 500 U.S. mid-cap financials to choose from (i.e., those with market caps between $0.5 bln and $20 bln), we believe there is significant opportunity to construct a portfolio with exposure to higher growth regions/MSAs (and higher revenue/earnings growth) and with more targeted attributes, including higher rate sensitivity, M&A potential, and valuation support.
We recommend investors consider allocating at least 30% of their U.S. financials allocation in U.S. mid-caps given the category’s significant breadth, high quality, and favourable fundamentals.
Notes
1 The U.S. financials are those represented by the S&P Financials Selector Sector Index, the S5FINL Index (ex-Berkshire). We have excluded Berkshire because its large quarterly investment gains/losses disproportionately impact the earnings growth at S5FINL. Earnings growth for each position is calculated using most recent quarterly adjusted EPS (or FFO) divided by the prior year’s quarterly adjusted EPS (or FFO), capped at +/- 100%.
2 Price ratio of the KBW Regional Banking Index vs. the KBW Bank Index as of May 4, 2018
3 Price ratio of the KBW Regional Banking Index vs. the Standard and Poor’s 500 Financials Index as of May 4, 2018
Note: Comments, charts and opinions offered in this commentary are produced by Hamilton Capital and are for information purposes only. They should not be considered as advice to purchase or to sell mentioned securities. Any information offered is believed to be accurate, but is not guaranteed.