

In Q4 2018, the holdings in the Hamilton Capital U.S. Mid-Cap Financials ETF (USD) (ticker: HFMU.U) recorded year-over-year portfolio-weighted EPS growth of a robust 32%[1], supported by excellent fundamentals including rising margins, solid volume growth and the reduction in the U.S. corporate tax reduction (which added roughly ~18% to this growth rate). As we explained in our insight “U.S. Bank M&A: Implications from the Largest Deal in a Decade” (February 8th, 2019), we believe consolidation will become an increasingly important theme.
This strong result was nearly 1,300 bps ahead of the 19% EPS growth reported by the U.S. large-cap financials index[2]. While HFMU.U’s insurance holdings performed very well, earnings growth for the large-cap financials index was weighed down by large catastrophe (or “cat”) losses at certain P&C insurers[3] from California wild fires and hurricanes (as well as lower capital market earnings at U.S. investment banks namely GS and MS). That said, if insurers with unusually large cat losses were excluded, portfolio-weighted EPS for HFMU.U would still have been ~1,000 bps higher.
This is the sixth consecutive quarter since the ETF’s inception that earnings growth for HFMU.U’s holdings has (materially) outpaced that of the U.S. large-cap financials. Also, with the impact of a rising Fed Funds rate and tax reforms receding, we anticipate EPS growth to return to a more ‘normal’ level for this group of companies, i.e., closer to 10%.
The largest contributor to HFMU.U’s superior earnings growth in Q4-18 was the performance of its mid-cap bank holdings, which represent well over 60% of the ETF (and are largely unrepresented in the index). These 40+ mid-cap banks grew EPS by 32% Y/Y, nearly 1,000 bps higher than the regional banks and 300 bps better than the 4 mega-cap banks. HFMU.U’s higher growth was also evident across the other major sub-sectors, most prominently insurance (HFMU.U at 26% y/y growth versus a 3% decline for the large-cap insurers) and wealth management (43% y/y growth for HFMU.U holdings versus 19% for the large-cap wealth managers).
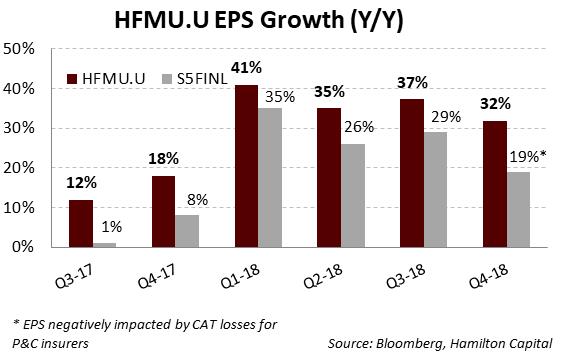
As the chart above highlights, portfolio weighted EPS growth for HFMU.U has exceeded the large-caps financials by a material amount every quarter since inception, i.e., between 600 bps to 1,300 bps. We attribute this meaningfully higher EPS growth to stock selection including an emphasis on: (i) higher growth U.S. MSA/states, (ii) overweighting banks and wealth managers with rate sensitivity (during a period of rising Fed Fund rate), and less significantly (iii) ongoing consolidation.
We continue to believe that investors seeking exposure to the U.S. financials sector should allocate a material component to U.S. mid-caps given the category’s significant breadth, high quality, and favourable regulatory and operating backdrop.
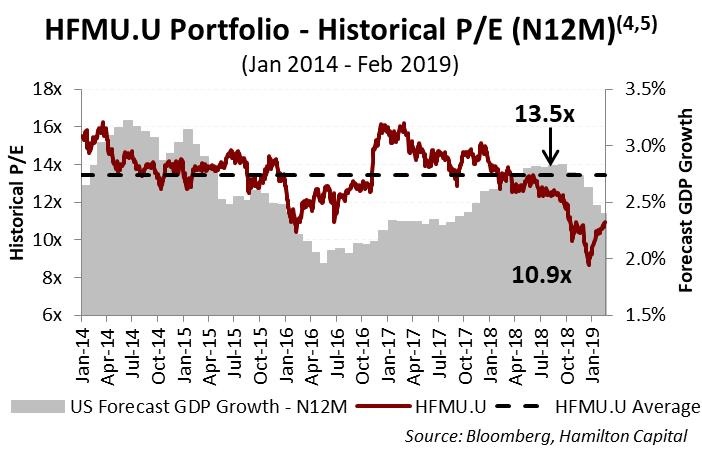
Moreover, U.S. mid-cap financials continue to trade at valuation discounts offering the potential for multiple expansion. As the chart below highlights, the current holdings of HFMU.U trade at 10.9x, a nearly 20% discount to their five year average.
Notes
[1] With 93% of HFMU.U reporting and assumes remaining holdings report EPS equal to consensus.
[2] The U.S. financials are those represented by the S&P Financials Selector Sector Index, the S5FINL Index (ex-Berkshire). We exclude Berkshire Hathaway because its large quarterly investment gain/loss creates significant variability that disproportionately impacts the earnings growth of S5FINL (both positively and negatively). Earnings growth for each position is calculated using most recent quarterly adjusted EPS (or FFO) divided by the prior year’s quarterly adjusted EPS (or FFO), capped at +/- 100%.
[3] In Q4, the following P&C insurers in the S5FINL Index (ex-Berkshire) – CB, TRV, ALL, HIG, L, RE and AIZ – reported large catastrophe related losses.
[4] Portfolio weights as of February 15, 2019
[5] GDP data is a blended forward 12 month forecast of quarterly estimates. Data prior to October 31, 2014 uses actual GDP growth (versus market forecast).