
900 bps Ahead of U.S. Large-Cap Financials
In Q2-2018, the holdings in the Hamilton Capital U.S. Mid-Cap Financials ETF (USD) (HFMU.U) have recorded year-over-year portfolio-weighted EPS growth of a robust 35%, a full 900 bps ahead of the 26% EPS growth reported by the U.S. large-cap financials index1. This is the fourth consecutive quarter since its inception that earnings for HFMU.U’s holdings have outpaced the U.S. large-caps financials.
The largest contributor to HFMU.U’s superior earnings growth in Q2-18 was the performance of its mid-cap bank holdings, which represent well over 60% of the ETF (and are largely unrepresented in the index). These 40+ banks grew EPS by 35% Y/Y, which was a highly material 1,200 bps better than the 4 mega-cap banks, which dominate the U.S. large-cap financials index (approximately one-third of total).
HFMU.U’s higher growth was also evident across the other major sub-sectors, most prominently insurance (HFMU.U at 30% versus 12% for the large-cap insurers in the index) and wealth management (43% for HFMU.U versus 38% for the large-caps).
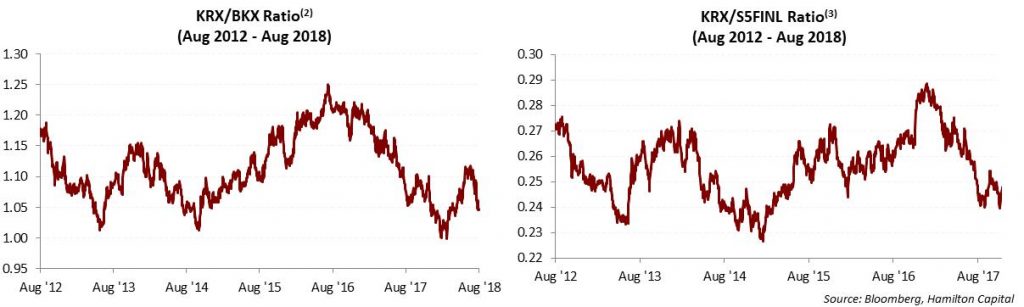
Interestingly, even though the largest component of the index, large-cap banks – again – reported much lower EPS growth than HFMU.U, the U.S. Large-Cap Financials index has performed very well, supported by multiple expansion for the 4 mega-cap banks, which represent ~35% of the entire index. By historical standards, the U.S. mid-cap banks are also technically oversold (see below).
With over 500 U.S. mid-cap financials to choose from (i.e., those with market caps between $0.5 bln and $20 bln), we believe there is significant opportunity to construct a portfolio with exposure to U.S. regions/MSAs with a stronger economic outlook than the national average and by extension higher revenue/earnings growth for banks operating in these markets. We also seek greater interest rate sensitivity, M&A potential, and valuation support in HFMU.U.
We continue to believe that investors seeking exposure to the U.S. financials sector allocate a material component to U.S. mid-caps given the category’s significant breadth, high quality, and favourable regulatory and operating backdrop.
Notes
1 The U.S. financials are those represented by the S&P Financials Selector Sector Index, the S5FINL Index (ex-Berkshire). We have excluded Berkshire Hathaway because its large quarterly investment gain/loss creates significant variability that disproportionately impacts the earnings growth at S5FINL (both positive and negative). Earnings growth for each position is calculated using most recent quarterly adjusted EPS (or FFO) divided by the prior year’s quarterly adjusted EPS (or FFO), capped at +/- 100%.
2 Price ratio of the KBW Regional Banking Index vs. the KBW Bank Index as of August 2nd, 2018
3 Price ratio of the KBW Regional Banking Index vs. the Standard and Poor’s 500 Financials Index as of August 2nd, 2018
Note: Comments, charts and opinions offered in this commentary are produced by Hamilton Capital and are for information purposes only. They should not be considered as advice to purchase or to sell mentioned securities. Any information offered is believed to be accurate, but is not guaranteed.