

In the Hamilton Capital U.S. Mid-Cap Financials ETF (USD) (TSX: HFMU.U) and the Hamilton Capital Global Bank ETF (TSX: HBG) our exposure to the U.S. mid-cap banking sector is ~65% and ~48%, respectively (owing to the sector’s low dividend yields, Hamilton Capital Global Financials Yield ETF has just 10% exposure to U.S. banks).
In prior posts, we have highlighted our preference for the U.S. mid-cap financials sector over their large-cap peers for three reasons: (i) higher expected EPS growth (i.e., actively managed portfolio can emphasize higher growth regions/MSAs), (ii) greater interest rate sensitivity (on balance), and (iii) ongoing benefits of consolidation/M&A. Moreover, given that we view the U.S. mid-caps as one of the most attractive segments within the global financial sector, we launched HFMU.U, which is – to the best of our knowledge – the only pure-play U.S. mid-cap financials ETF globally[1].
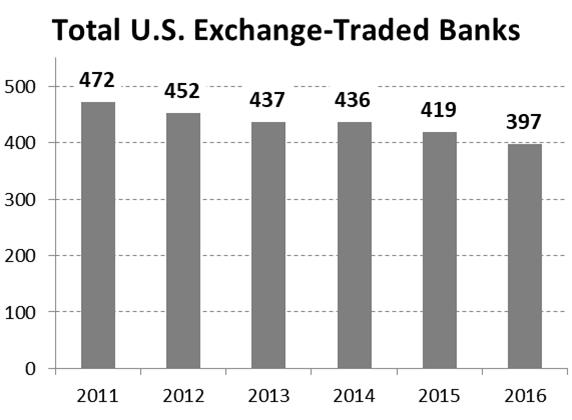
In this post, we are providing two charts highlighting the pace of U.S. bank consolidation and the breakdown by market capitalization. The first chart “Total U.S. Exchange-Traded Banks” shows that there are just less than 400 exchange-traded banks in the U.S. as of December 31, 2016. It also highlights that the number of banks absorbed through consolidation averaged about 15 banks a year since 2011, for an overall decline of over 16%.
The second chart shows the breakdown of U.S. banks by size[2] highlighting that the vast majority of publicly traded banks – i.e., all but 10 – are small or mid-cap. Not surprisingly, virtually all of the consolidation shown is taking place within these categories. We would also note that the sheer number of mid-cap banks – i.e., over 170 – provides substantial opportunity to gain exposure to higher growth regions/MSAs, including the U.S. Southeast and Southwest, where population growth can be more than 4x faster than the Midwest and Mid-Atlantic.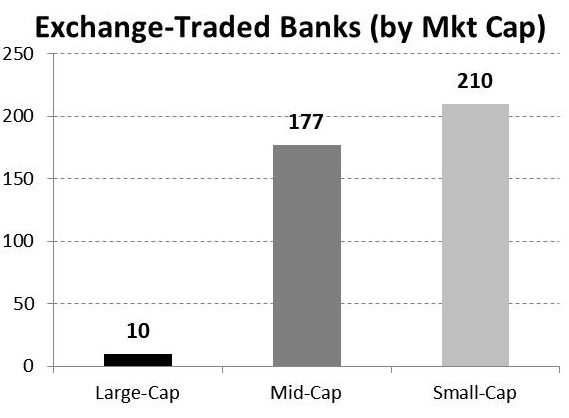
Over the past few years, we have written often about the U.S. banking sector including the ongoing consolidation. Notes that may be of interest include:
Notes from the Field: “Follow the Sun”/Catching Up with U.S. Banks in Phoenix
Notes from the Field: Everything is Peachy in Atlanta
Notes from the Field: U.S. Mid-Cap Bank Meetings in New York
Canadian Banks: Why U.S. Mid-Cap Banks are Easier to Acquire (than 10 Years Ago)
Notes from Florida Bank Tour: Commercial Real Estate lending and M&A under the Microscope
Notes from Florida: KBW Financial Services Symposium
Notes from Texas Bank Tour: Is This Time Different from Previous Downturns?
U.S. Banks: Revisiting “100 Bank Mergers”, 3 Years Later
Notes
1 Defined as those financial services firms with a market capitalization of between US$500 mln and US$20 billion
2 As of December 2017. Large-cap banks are those banks with a market cap above US$20 bln; mid-caps are between $500 mln and $20 bln; and small-caps are below $500 mln.